Why use MITRE ATT&CK for threat hunting?
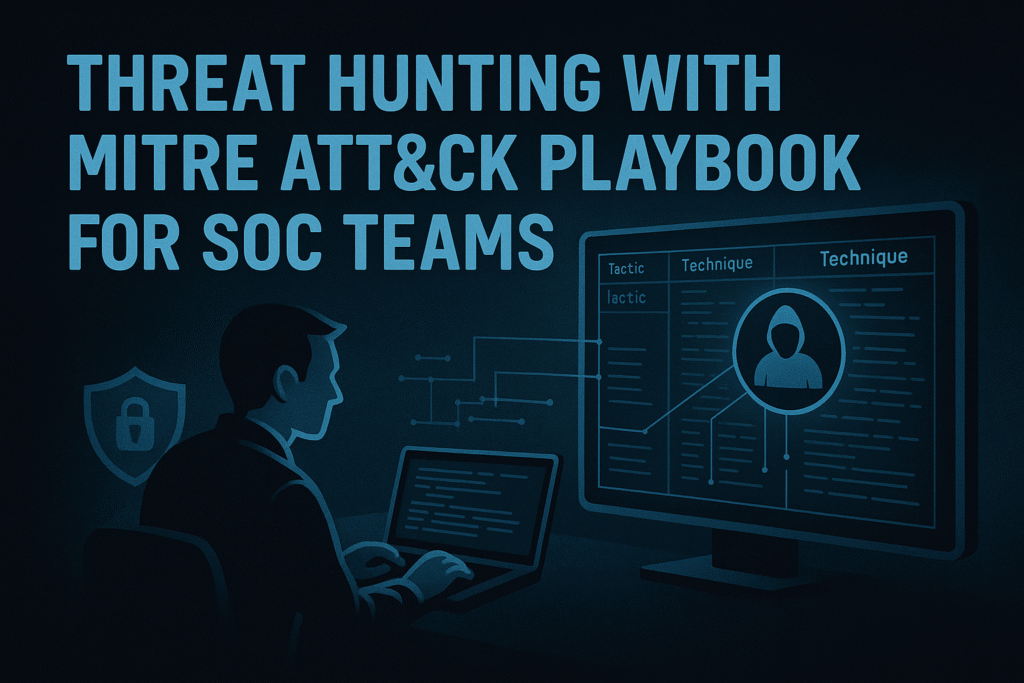
MITRE ATT&CK provides a common language for adversary tactics and techniques. For threat hunting, ATT&CK helps teams prioritize hunts, map telemetry gaps, and create repeatable detection playbooks that tie directly to real-world attacker behavior.
Benefits:
- Shared terminology across teams (threat intel, SOC, IR)
- Prioritized technique lists for your environment
- Faster hypothesis building and measurable coverage
Prerequisites: what you need before you hunt
- Inventory & context: Asset inventory (hosts, cloud workloads, SaaS apps).
- Telemetry sources: Endpoint (EDR), network flows, proxy logs, EDR process/command logs, cloud logs (CloudTrail, GCP/Azure equivalents), identity logs (OKTA/Azure AD), SIEM/Log store.
- Hunting platform: SIEM or log analytics (Splunk, Elastic, Sentinel), notebook/hunt management (Jupyter, DFIR playbooks, MISP).
- Baseline: Normal behavior baselines per asset/user group (process families, login hours, common ports).
Step-by-step playbook (repeatable)
1) Select & prioritize techniques
Use ATT&CK to pick techniques to hunt. Prioritize by:
- Business impact (e.g., SaaS compromise, payment systems)
- Recent threat intel / active campaigns
- Known exposures in your environment (unpatched services, third-party apps)
Example priority bucket: Lateral Movement → Credential Access → Persistence → Data Exfiltration.
2) Build a hypothesis
Form a concise hunting hypothesis:
“Within the last 7 days, endpoints in our developer subnet will show anomalous command-line usage tied to credential dumping attempts.”
A good hypothesis includes timeframe, scope, and expected indicators.
3) Map telemetry to techniques (coverage matrix)
Create a 1–page mapping: Technique → Required telemetry → Existing coverage? → Detection maturity (None / Investigate / Mature).
Example entry:
- Technique:
T1003 Credential Dumping - Telemetry: process command line, loaded DLLs, suspicious LSASS access, abnormal credential cache access
- Coverage: EDR process logging = Yes; LSASS access telemetry = Partial
- Action: Enable process tree capture; add detection for suspicious mimikatz patterns
4) Write detection queries (defensive focus)
Create queries designed to find anomalous behavior — not exploits. Example (pseudocode for SIEM):
- Unusual Parent/Child Process Combinations
index=endpoint process_name IN ("powershell.exe","cmd.exe") | where parent_process not in ("explorer.exe","services.exe","taskeng.exe") | stats count by host, user, parent_process, process_name, cmdline - Exfil via unusual network endpoints
index=netflow dest_port NOT IN (80,443,53) | where bytes_out > bytes_in*2 | stats count by src_ip,dst_ip,dst_port
(Do not copy/paste exploit code — these queries are defensive patterns to highlight anomalies.)
5) Triage & validate findings
For each hit:
- Enrich with asset owner, recent vulnerability scans, and recent alerts.
- Pull full process tree and related network connections (EDR).
- Confirm whether activity is benign or malicious (false positive check).
6) Respond and harden
When you confirm malicious activity:
- Isolate affected hosts.
- Rotate credentials and invalidate sessions for impacted identities.
- Apply targeted hardening: patch, disable unused services, restrict API tokens.
- Add detections to the coverage matrix.
7) Document, measure, and iterate
- Document the hunt: hypothesis, queries, hits, investigation notes, remediation.
- Measure metrics: mean time to detect (MTTD), mean time to respond (MTTR), number of techniques covered, % telemetry gaps closed.
- Feed intel back into playbooks and detection rules.
Use cases & example hunts mapped to ATT&CK (high level)
- SaaS compromise / OAuth abuse — Hunt for suspicious token creation events, unusual IPs requesting token exchange, and anomalous API calls.
- Supply-chain / code repo compromise — Look for abnormal CI/CD job triggers, unexpected commits from low-reputation IPs, or code package checksum changes.
- Living-off-the-land (LOTL) — Detect uncommon use of legitimate tools (e.g.,
rclone,curl,powershell) originated from non-admin accounts or unusual hours.
Telemetry & tooling checklist (quick)
- Endpoint: process creation with full command line, parent/child process tree, file write events, DLL loads.
- Network: DNS logs (full query names), HTTP(S) logs (SNI, Host), NetFlow/PCAP for anomalies.
- Identity: failed/successful auths, token issuance, conditional access events.
- Cloud: API calls, console logins, IAM changes, storage object access.
- Dev/CI: build logs, artifact uploads, package manager activity.
KPIs to track success
- % of critical ATT&CK techniques covered by at least one detection.
- Time from hypothesis to detection rule (days).
- Reduction in false positive rate per detection iteration.
- Hunts executed per quarter and percent leading to confirmed findings.
Common mistakes & how to avoid them
- Noise over signal: Poorly scoped queries create analyst fatigue. Start narrow, expand scope.
- Blind telemetry gaps: Don’t assume “we have logs” — validate fields and retention.
- No feedback loop: If hunts don’t update detection rules, you’ll repeat work. Capture lessons and encode them.
Readiness playbook (one-page checklist)
- Inventory & owners: ✅
- Minimum telemetry sources enabled: ✅
- Hunt hypotheses backlog: ✅
- Playbooks documented & tested: ✅
- Automation for containment: partial — iterate.
Closing thoughts
Threat hunting with MITRE ATT&CK is a practical path to elevating detection capability across your enterprise. The framework lets you convert threat intelligence into specific, measurable hunts and repeatable remediation steps. Start small, measure impact, and continuously close telemetry gaps — that’s how SOCs move from reactive alerts to proactive defense.


